Chapter 3 Wrangling
“The work that you do with data wrangling others would call ‘data plumbing’ or even janitorial work, but when you have somebody who knows how to wrangle data and gets into a flow of data wrangling, it’s an elegant dance to watch.” —Stephanie McReynolds, Strategic Adviser, Nexla
In Chapter 2, we introduced the idea of rectangular data vs. non-rectangular data, providing examples for each and demonstrating the process of rectangularization. We outlined how to use a web-API before a light introduction to web scraping. In this chapter, we will familiarize ourselves with data wrangling, the art of cleaning up our data.
Furthermore, in Chapter 2, we briefly touched on the notion of tidy data: data structures where observations are given by rows, variables are given by columns, and values are given by cells. The notion of tidy data was formalized by Wickham and others (2014), Chief Scientist at RStudio and creator of the Tidyverse universe, to reduce the amount of work involved in preparing data. Data preparation, or data cleaning, is often a time consuming task with real data. Since it’s necessary to format data as tidy data to use the vast network of packages within the Tidyverse, we always need to first structure our data as tidy data.
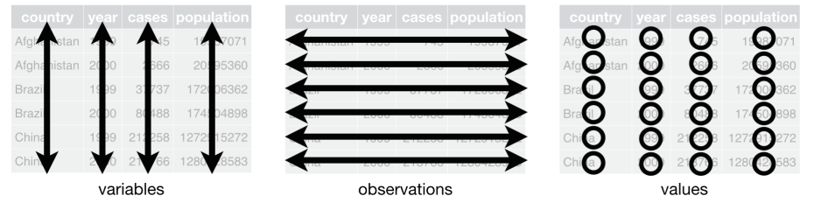
Figure 3.1: visualizing tidy data
In the following subsections, we will be cleaning up those data gathered from Pro Football Reference.
Any feedback for this section? Click here
References
Wickham, Hadley, and others. 2014. “Tidy Data.” Journal of Statistical Software 59 (10): 1–23.