2.1 Background
To understand R Markdown, we first need to tackle Markdown. According to its website, Markdown is a markup language you can use to format virtually any document. Unlike Microsoft Word and other WYSIWYG editors, you make changes to a document by adding syntax to text rather than using buttons and menus. In essence, Markdown syntax are code which need to be processed before the content can be viewed as HTML. One such markdown processor is pandoc which we will see again soon.
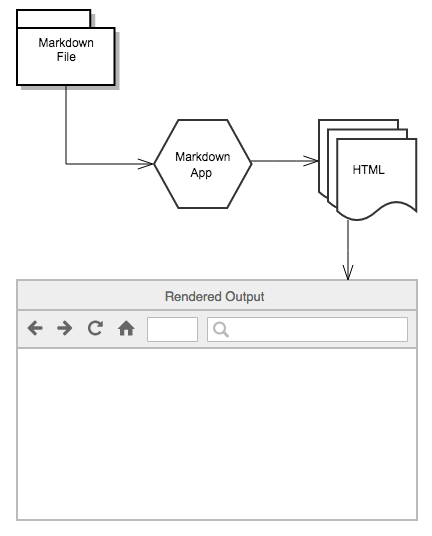
Figure 2.1: schmatic diagram describing how markdown is rendered
To simplify things, R Markdown is a variant of Markdown created by RStudio to incorporate the functionality of Markdown and R. With R Markdown, you can combine human readable text, code, and figures to create a document. While R Markdown is incredibly robust, allowing you to make reports, presentations, and even dashboards, we will start by focusing on the simplest case: creating a report. Compiling an R Markdown document requires your computer to process the Markdown code used to create human readable text, R code used to conduct analysis, and the R code output used to portray results. We will reserve the technical details for Xie, Dervieux, and Riederer (2020).
It is easy to confuse R, R Markdown, and RStudio. Try your best to separate these ideas from one another. R is a statistical programming language (proclaimed as a software environment for statistical computing and graphics), whereas R Markdown is a markup language (think of this as an environment for creating a document). RStudio, on the other hand, is the most popular integrated development environment (or IDE, for short) for R. RStudio, like good IDEs should, makes it easier for you to code in R by providing a user friendly landscape to write, run, and debug code.